Complete your purchase
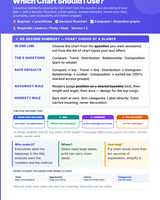
Which Chart Should I Use? – Data Visualization Guide
4.99 €
A 23-page visual guide to choosing the right chart for your data. Learn when to use bar charts, line charts, histograms, scatter plots, heatmaps, box plots, and more, with decision flowcharts, practical examples, and Python code.
PDF · 23 pages · English · Beginner
Secure payment
via Stripe Checkout
Instant delivery
Download after payment
No account needed
Guest checkout